

Get free pharmaceutical analytical calculation examples, Excel tools, and articles delivered to your inbox
Excel Tools Built for Pharmaceutical Scientists
Used by Scientists in Pharmaceutical and Analytical Laboratories Worldwide
Validated Excel templates for dissolution, content uniformity, and analytical calculations—built to reduce manual work and improve consistency
Pharmaceutical | Analytical | Quality Control | R&D Laboratories
Scientific Tools
Want more tools like these? Join the email list for updates and free resources.
Why Scientists Use Excel in Science
Validated Excel spreadsheets
Minimizes manual calculation errors
Ready for QC and analytical workflows
No need to build spreadsheets from scratch
Resources for Scientists
-

How to Calculate Void Volume in HPLC
The void volume is the volume that the mobile phase occupies in a column. Quickly calculate your column’s void volume using our FREE Excel template!
-
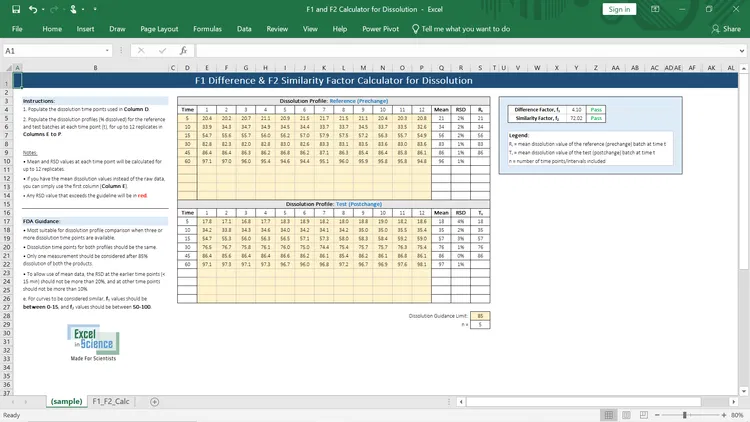
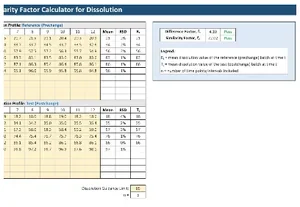
How to Determine f1 Difference & f2 Similarity Factors in Dissolution Testing
Learn how to calculate the f1 and f2 factors for dissolution testing. Download a free Excel template you can use!
-

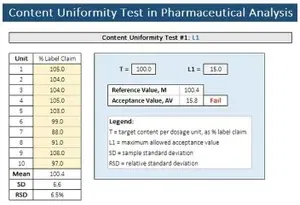
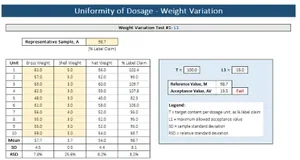
Content Uniformity in Pharmaceutical Analysis
To ensure the consistency of dosage units, it is crucial that each unit in a batch contains a drug substance content that falls within a narrow range around the label claim.
Start Using Validated Scientific Excel Tools
Subscribe for updates and free Excel tools