How to transform Empower raw data into an organized Excel table in 2 minutes
Raw data from Empower typically contains a ton of information that we do not need and extracting the important data can be a time-consuming task. It is crucial to streamline this process for maximum efficiency, especially when you need to obtain and analyze your experimental results quickly. This article provides a comprehensive guide on optimizing this routine task so you can focus on other tasks.
Microsoft Excel is an incredibly powerful tool for streamlining processes. With the aid of pivot tables, we can easily convert raw data into a neatly organized table. This allows for greater efficiency and effectiveness in data analysis and presentation.
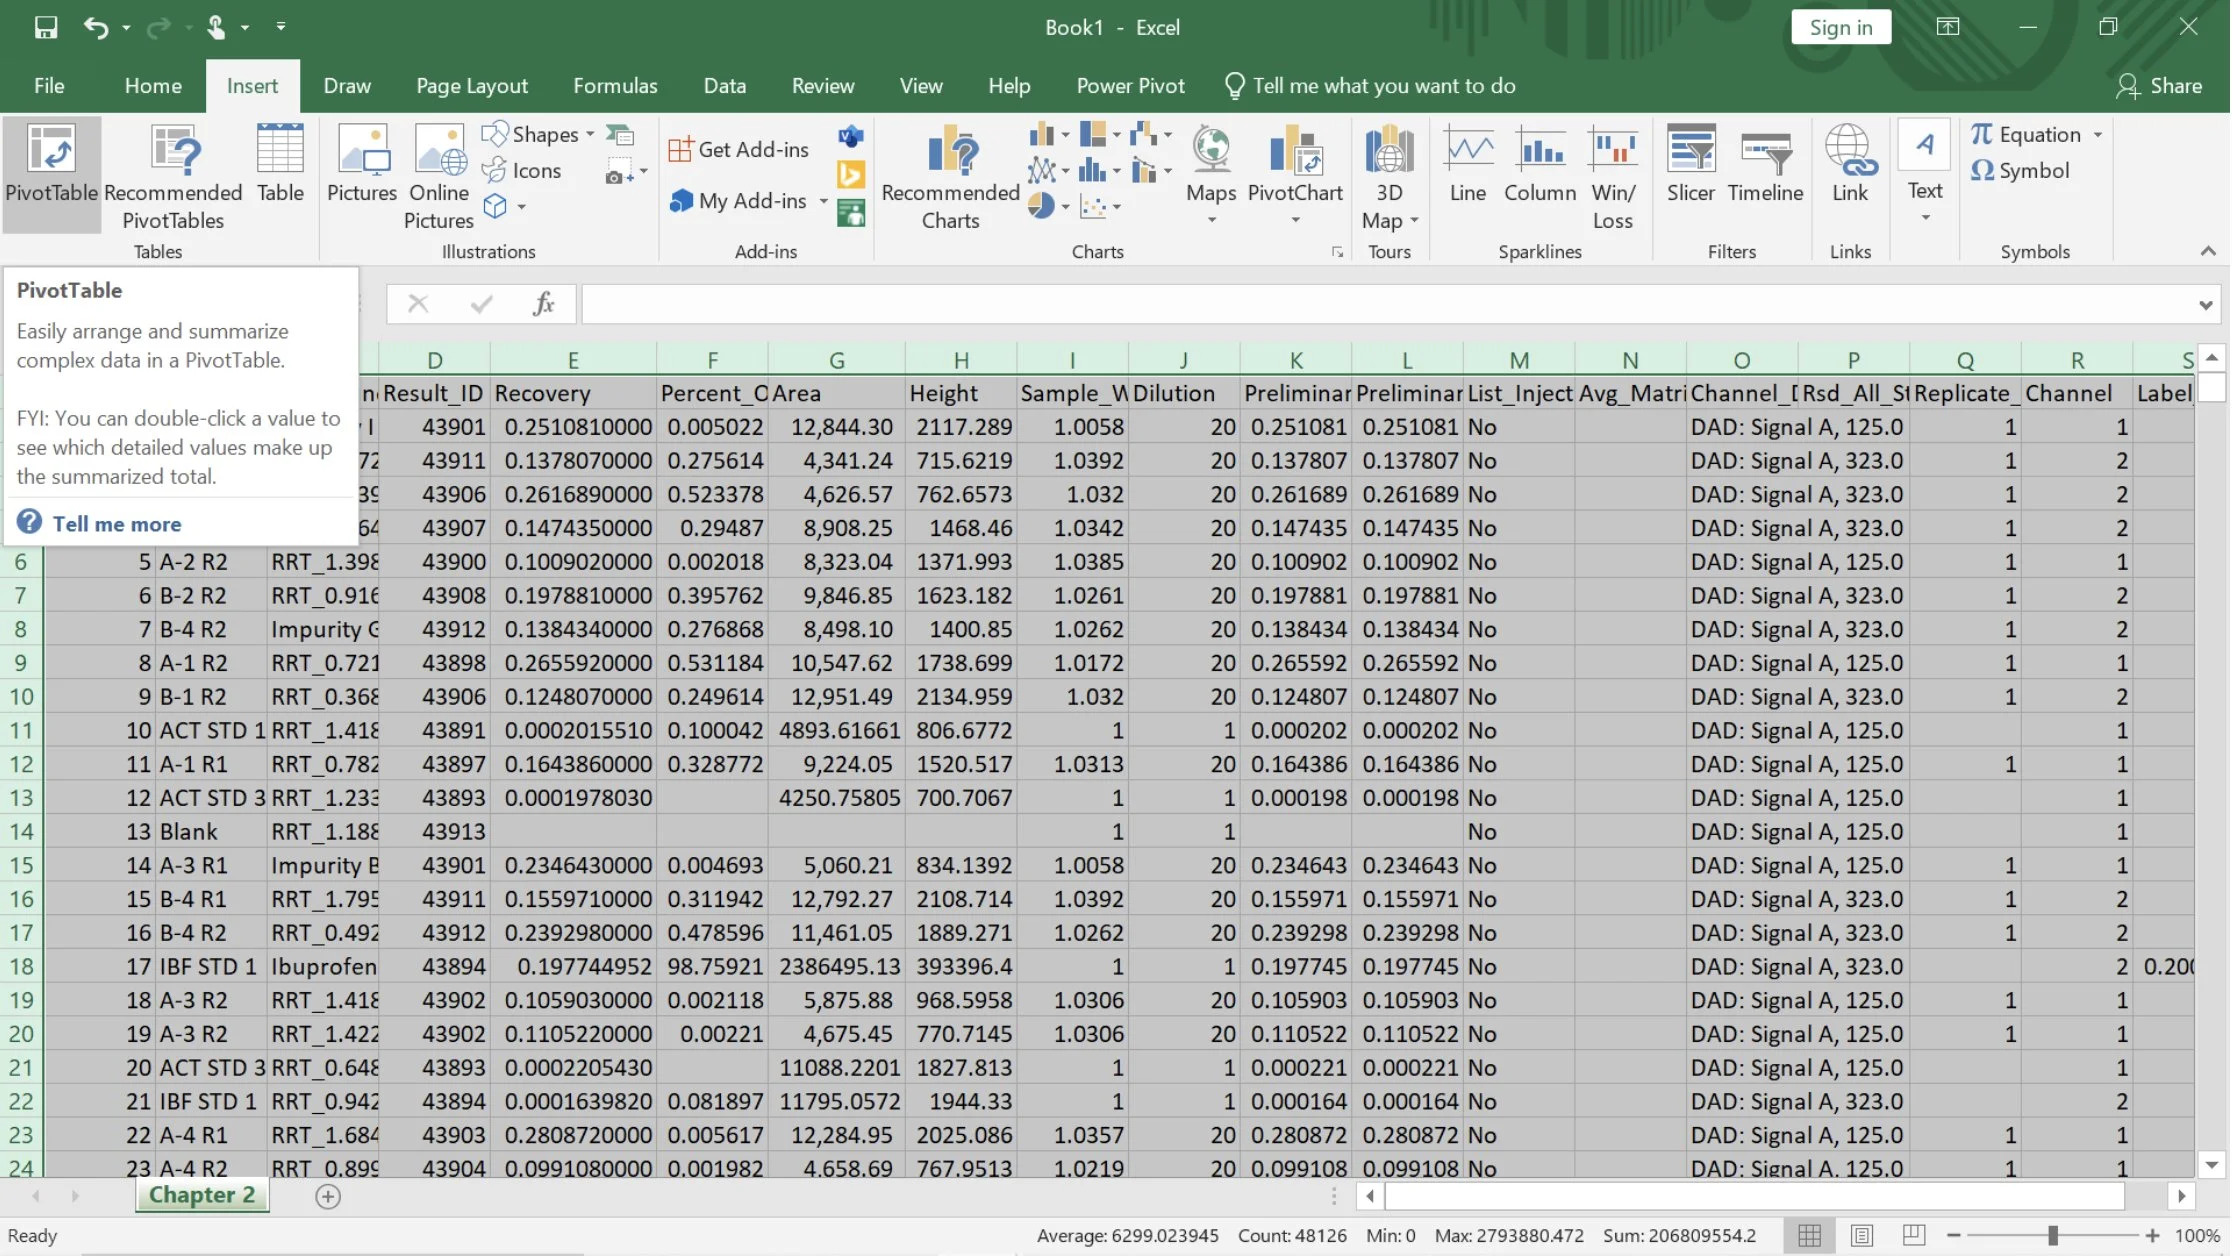
Below is an example of raw data output from Empower. Let’s say that we only need the Percent of Label Claim data for all of the samples at 323 nm. How do we get these data quickly in just a couple of minutes?

Step 1. Go to insert and click PivotTable. Excel will automatically select your entire data set.
Step 2. Choose New Worksheet to create the table in a new sheet. Click okay.

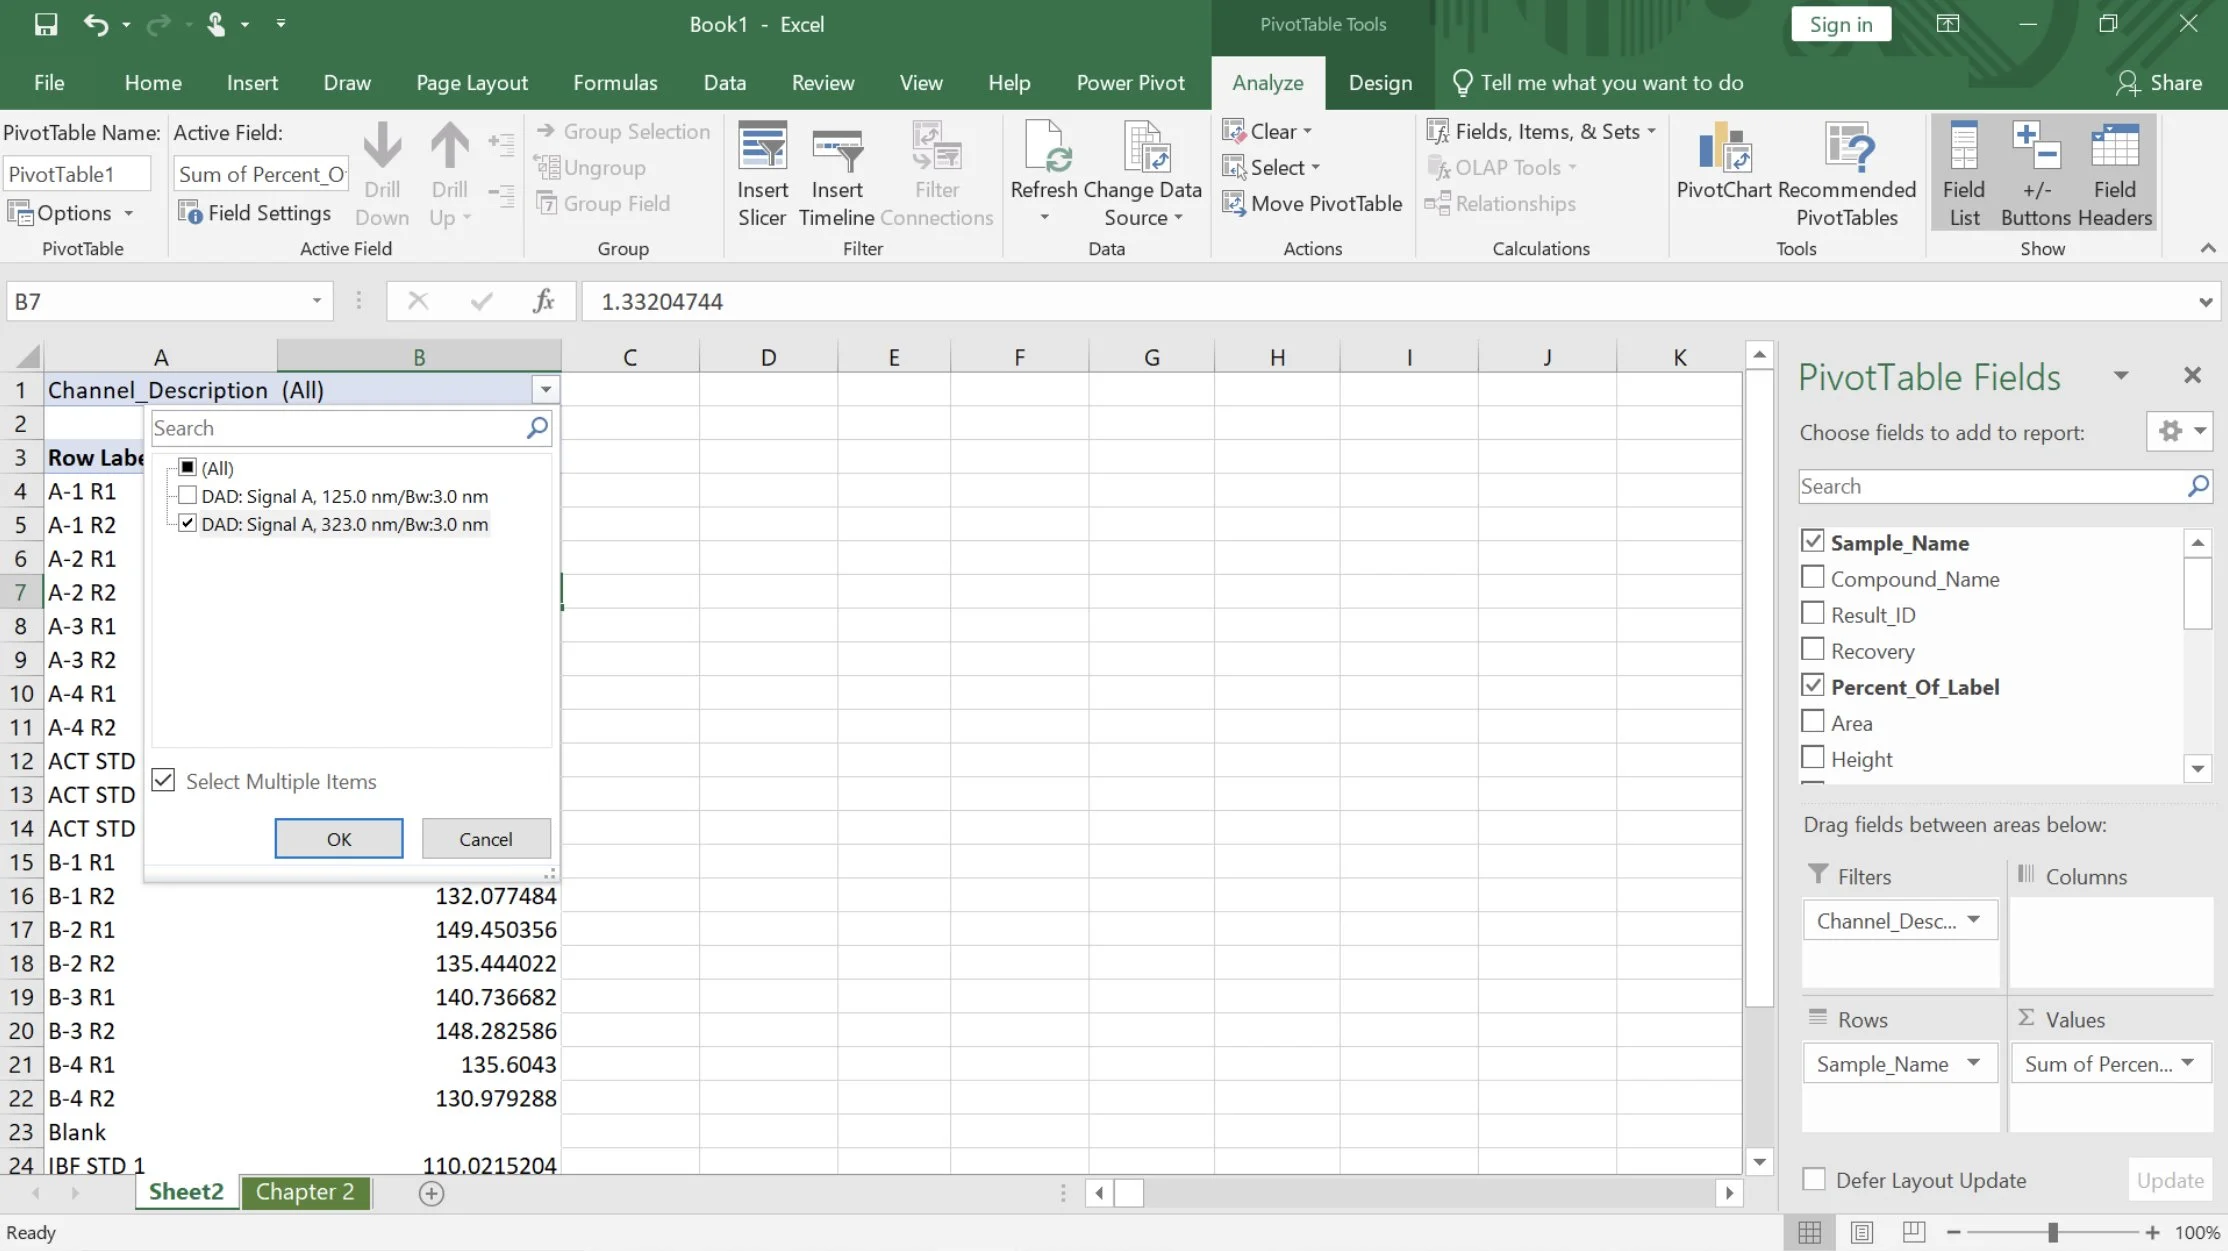
Step 3. On the right side of the sheet, we can see the pivot table fields pane. This is where we can choose the fields that we will use to build our table. We could drag and drop the following fields:
Sample name will be our rows
Channel description will be our filter
Percent of label will be our values
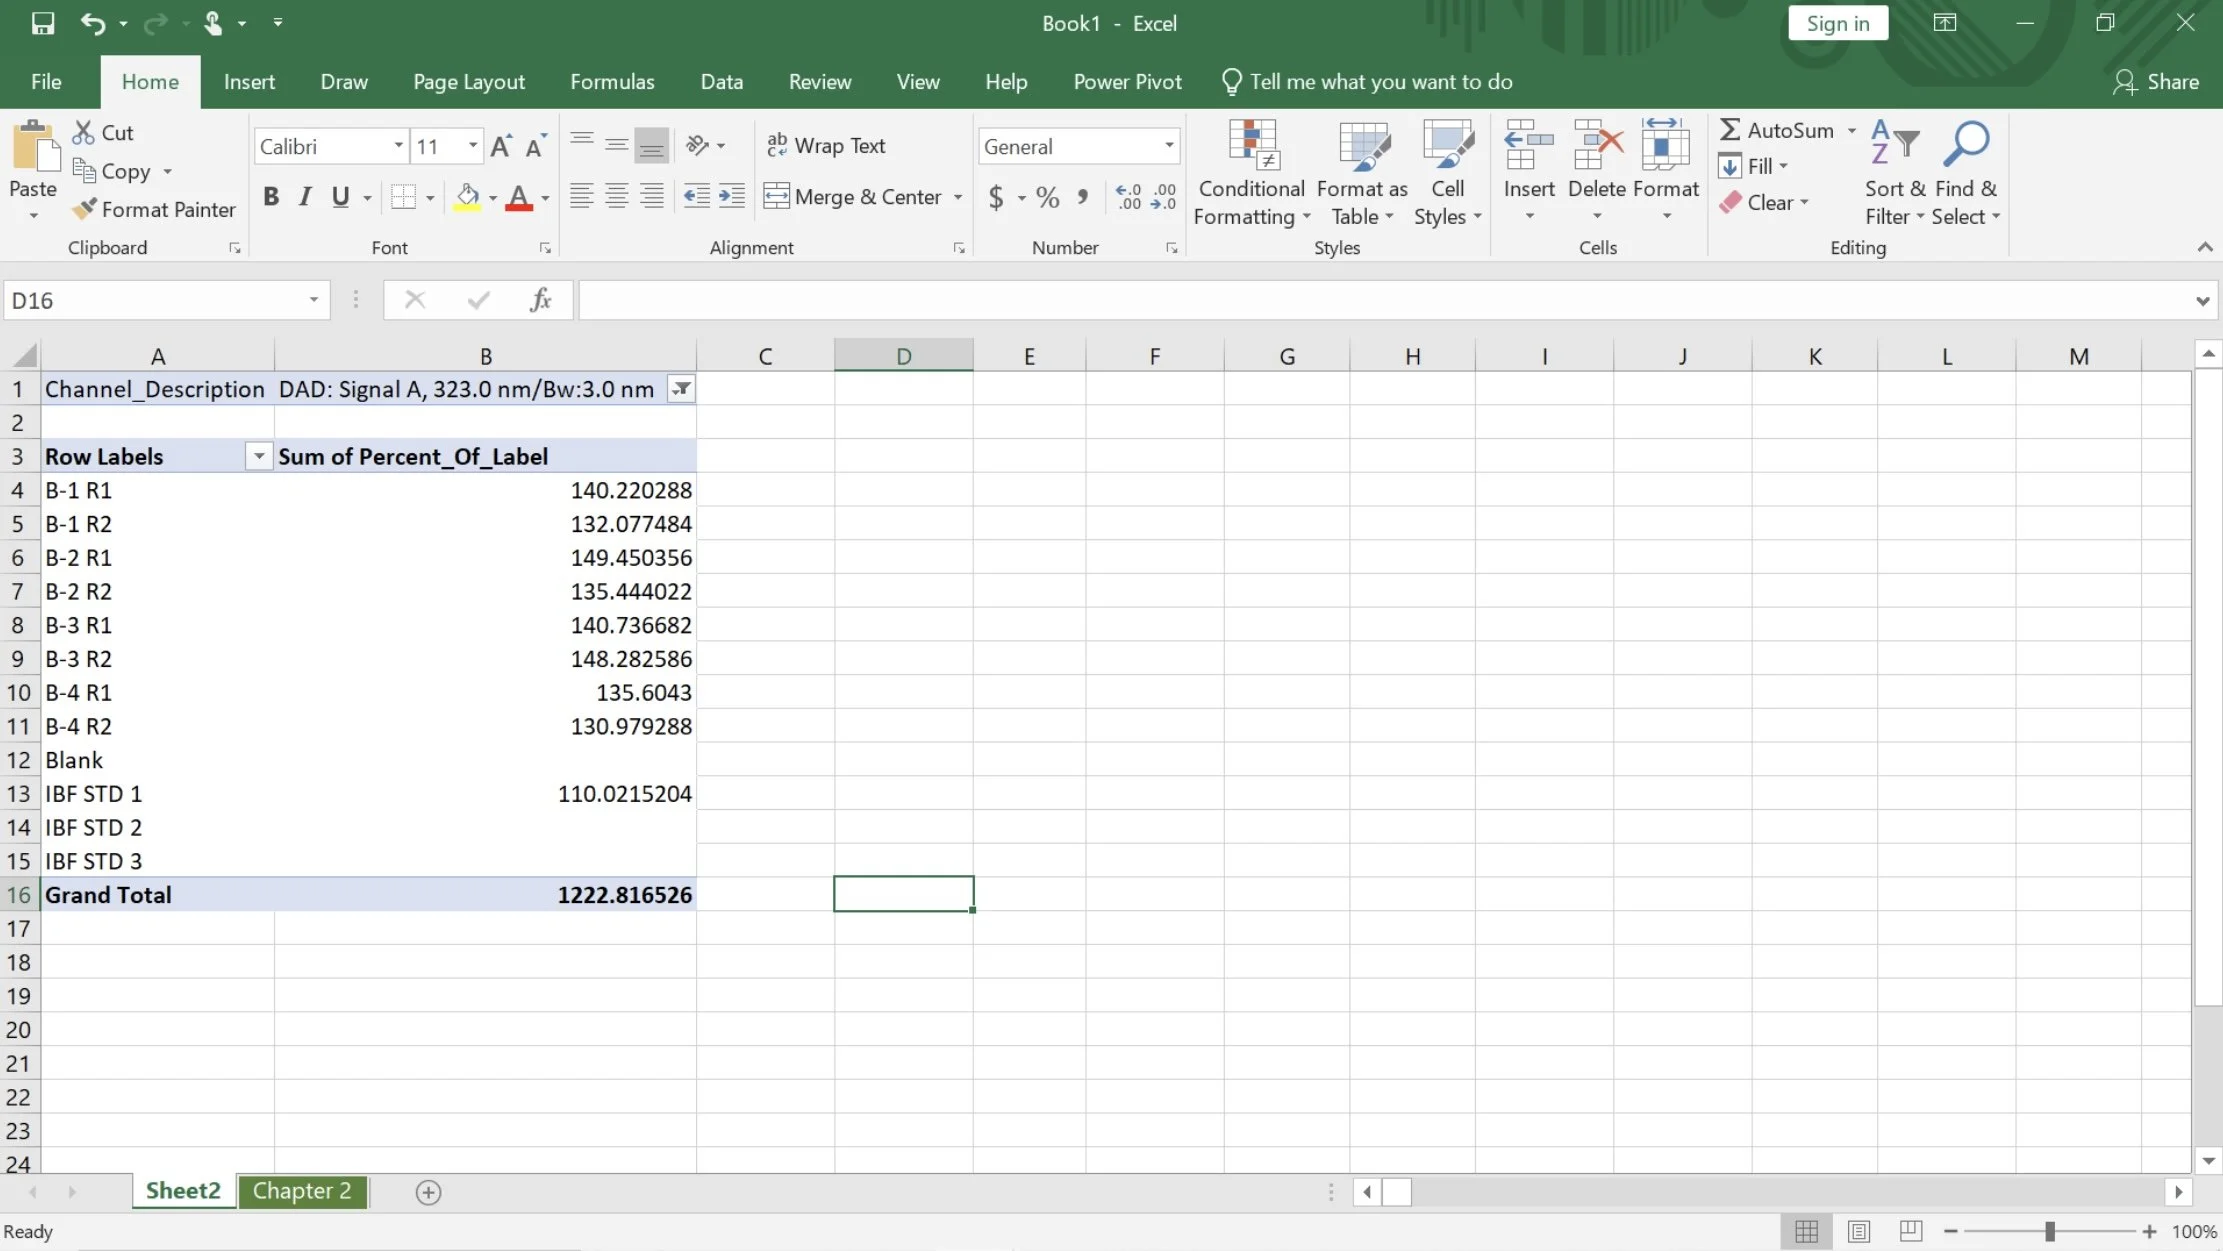
After rearranging the fields, the table below shows the data collected from all channels.

Step 4. To view only the data for 323nm, simply click on the dropdown menu in the channel description filter and uncheck the box for 125nm.
This is how easy it is to convert your Empower raw data into an organized Excel table below!