
The Magic Wand in GraphPad Prism: A User's Guide
GraphPad Prism is a powerful tool for statistical analysis and visualization. Among the many features it offers, the Magic Wand tool is particularly noteworthy. This tool, often overlooked, is a significant time-saver and aids in maintaining consistency across your datasets.
The Magic Wand tool in GraphPad Prism allows you to apply a specific analysis or format from one data table or graph to another without having to manually repeat the process. This feature is especially useful when dealing with multiple datasets that require the same form of analysis or formatting.
Follow the steps below to use the Magic Wand tool:
1. Perform your desired analysis or apply your desired format to one of your tables or graphs. For example, we would like to copy the format of the graph below:

2. Create the new graph to which you want to apply the same formatting.
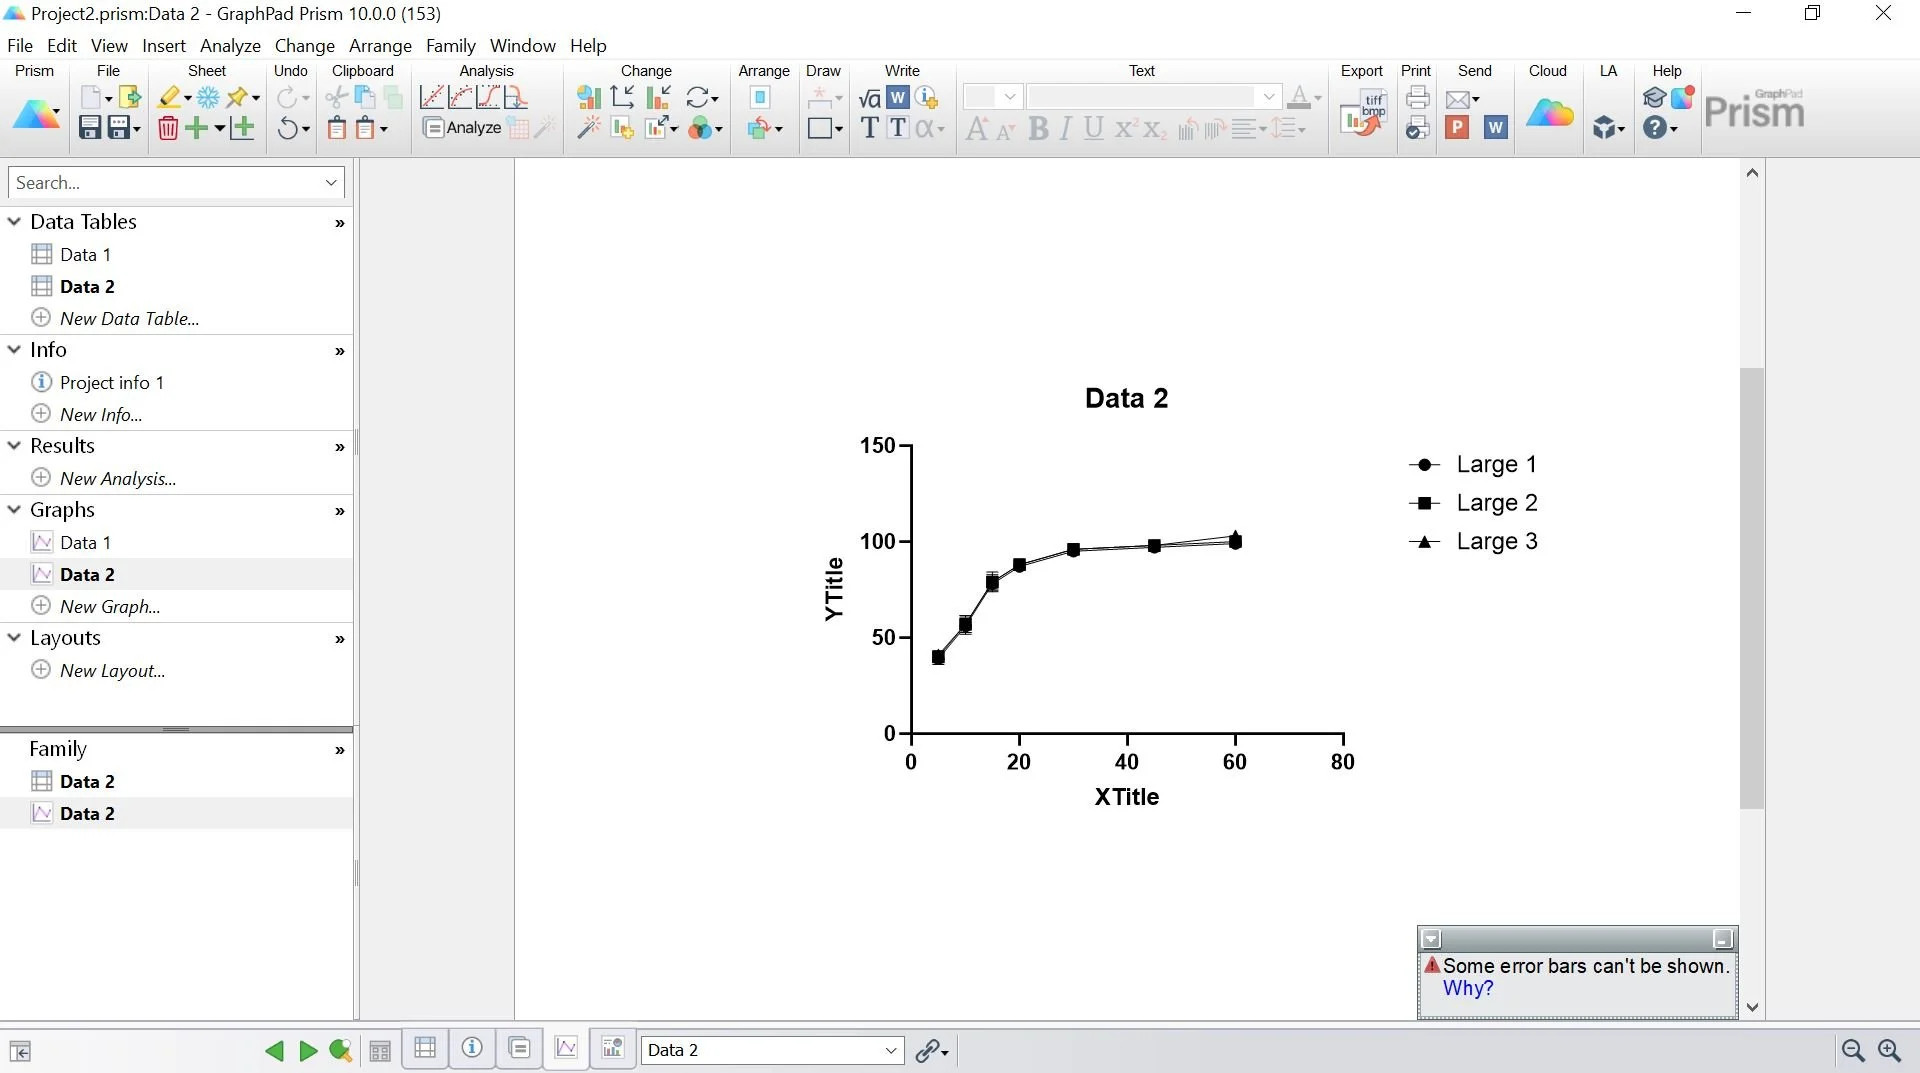
3. Click on the magic wand on the toolbox below under “Change”.

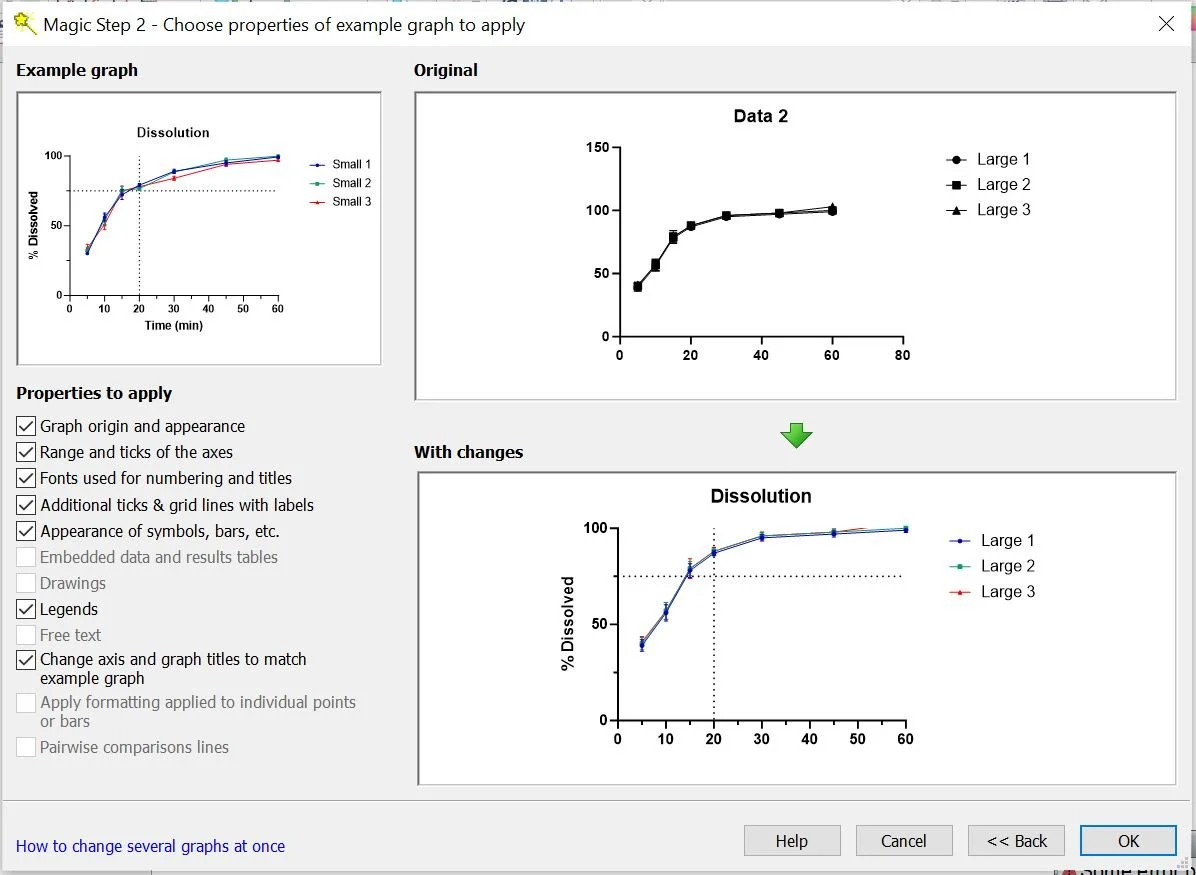
4. The window below will be displayed. Select the desired graph properties you wish to apply and click the "OK" button.
That concludes it! The updated table is displayed below, maintaining the same format as the previous graph. This process can be repeated for multiple graphs, saving a significant amount of time that would otherwise be spent editing each one individually.

Overall, the Magic Wand tool in GraphPad Prism is a powerful feature that accelerates data analysis and ensures consistency, thereby streamlining the research process and increasing productivity.
Do you have any questions or suggestions? Feel free to reach us by clicking here.