
Enroll in our Data Processing in Excel course for Scientists for only $99!

Harness the Power of Microsoft Excel for Scientific Analysis
Microsoft Excel is an incredibly powerful software program that has been around since 1985. It has been used in various fields from accounting to data analysis, but it is also a great tool for scientists!
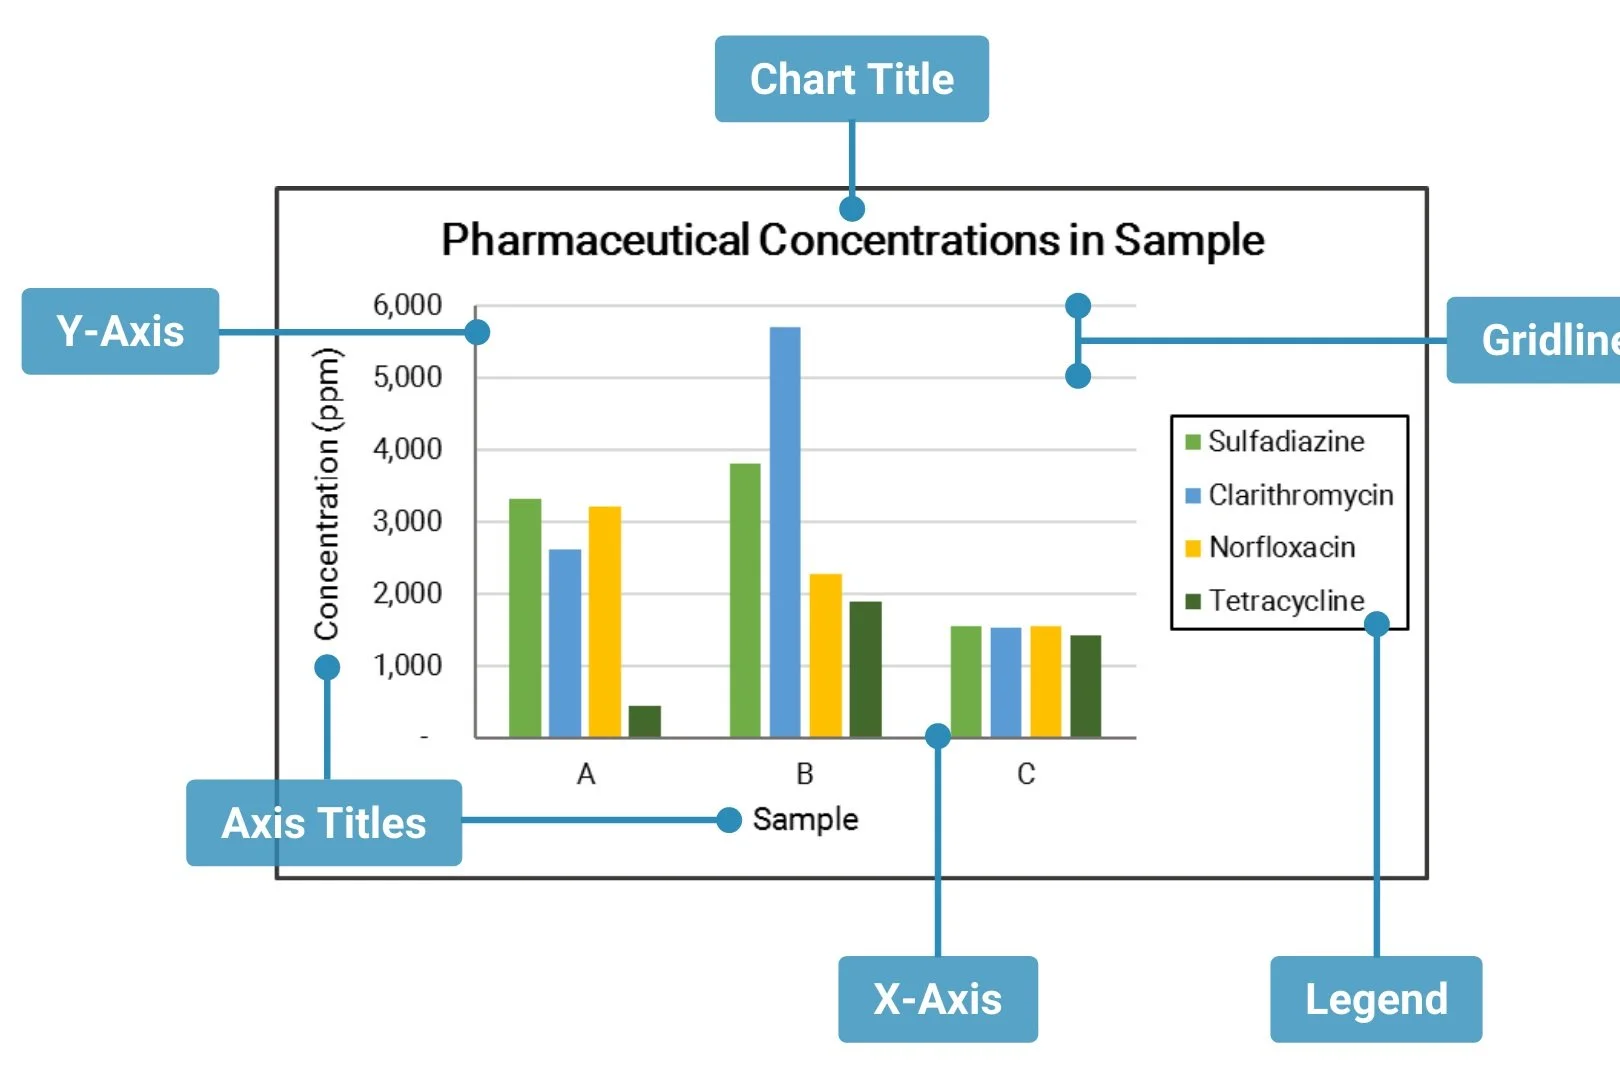
Which Type of Chart or Graph is Right for You?
In this article, we will talk about: 4 basic chart or graph types and when to use them. As well as 3 ways to create and layout your charts in Excel.

Locking your Columns and Rows Using Freeze Panes
To keep your columns and rows in place, use freeze panes in just two easy steps!
